Table of contents
Table of contents
How to draw an ER Diagram: Complete step-by-step guide
Summary
In this guide, you’ll learn:
- What entity relationship diagrams are and why they’re essential for preventing costly database design mistakes before implementation
- When to use ERDs: from starting new projects to onboarding team members and planning major feature additions
- Key components of ERDs: entities, attributes, relationships, and cardinality notations that form the building blocks of your diagram
- A 6-step process for creating ERDs: identify entities, define attributes, map relationships, add cardinality, refine your design, and document everything
- How to build an ERD with a real example: follow a complete walkthrough of designing a digital library system from requirements to finished diagram
- How to create ERDs in Miro: use AI-powered diagramming to generate initial structures from plain text descriptions, then refine collaboratively with your team
- Best practices for effective diagrams: naming conventions, layout strategies, and documentation standards that keep ERDs clear and maintainable
- Common mistakes to avoid: from over-complication and incorrect relationships to poor entity identification and missing stakeholder validation
Try Miro now
Join thousands of teams using Miro to do their best work yet.
Stop wasting hours trying to sync scattered documentation across multiple tools. When your database structure lives in static documents that no one updates, teams end up building on outdated assumptions. This leads to costly rework and misaligned implementations. Entity relationship diagrams solve this problem by creating a single visual source of truth that maps out exactly how your data connects, making database design faster and less error-prone.
What is an entity relationship diagram (ERD)?
An entity relationship diagram (ERD) is a visual representation that shows how different pieces of information in a database relate to each other. Think of it as a blueprint for your data structure. It displays entities (like “Customer” or “Order”), their attributes (like “email address” or “order date”), and the relationships between them (like “a customer places many orders”). ERDs bridge the gap between business requirements and technical implementation, giving both developers and stakeholders a clear picture of how data flows through a system.
Understanding Entity Relationship Diagrams
Entity relationship diagrams transform abstract data requirements into concrete visual models that guide database implementation. At their core, ERDs answer three fundamental questions: What information does the system need to store? How is that information organized? And how do different pieces of information connect to each other?
Core purpose: visualizing database structure and relationships
ERDs serve as the communication layer between business needs and technical execution. When a product manager says “we need to track customer purchase history,” the ERD translates that requirement into specific entities (Customer, Order, Product), their attributes (customer_id, order_date, product_name), and the relationships that connect them (Customer places Order, Order contains Product).
This visual format catches design flaws before a single line of code gets written. You might discover that your proposed structure can’t handle a customer with multiple shipping addresses, or that tracking product variations requires an additional entity you hadn’t considered.
When and why to use ERDs
Use ERDs whenever you’re working with structured data that needs to persist beyond a single session:
Starting a new project: Before writing database schemas or API contracts, map out your data model with an ERD. This prevents the painful refactoring that happens when you realize halfway through development that your structure won’t support key features.
Planning major features: Adding multi-tenancy to your SaaS product? Implementing a recommendation engine? These features often require significant changes to your data model. ERDs let you test different structural approaches before committing to one.
Onboarding new team members: A well-documented ERD cuts onboarding time dramatically. New engineers can see the entire data architecture at a glance instead of piecing it together from table definitions and join queries.
Communicating with stakeholders: Non-technical stakeholders may not understand database schemas, but they can grasp an ERD. This makes design reviews and requirement validation much more productive.
Key Components of an ERD
Every entity relationship diagram consists of four fundamental building blocks that work together to represent your data structure.
Entities
Entities are the core concepts your system tracks. They are the “things” that have data associated with them. In an e-commerce system, entities include Customer, Product, Order, and Category. In a library system, you’d have Book, Member, and Loan.
Think of entities as nouns that represent distinct, independent concepts requiring multiple pieces of information to describe them. Each entity becomes a table in your database. Entities are typically drawn as rectangles with the entity name at the top.
Naming convention: Use singular nouns (Customer, not Customers) because each entity represents one instance of that concept.
Attributes
Attributes are the individual pieces of data that describe an entity. For a Customer entity, attributes might include customer_id, first_name, last_name, email, and phone_number. These attributes become columns in your database table.
Every entity needs a primary key, which is a special attribute that uniquely identifies each instance. The primary key ensures you can distinguish between two customers even if they have the same name. Primary keys are typically marked with “PK” or underlined in ERD diagrams.
Attributes are listed inside the entity rectangle, below the entity name.
Relationships
Relationships define how entities connect to each other. They answer questions like “How do customers relate to orders?” or “What’s the connection between products and categories?”
Relationships are represented by lines connecting entities, often with a verb describing the connection:
- Customer places Order
- Product belongs to Category
- Employee manages Employee
In your database, relationships are implemented through foreign keys. These are attributes in one table that reference the primary key of another table.
Cardinality
Cardinality specifies how many instances of one entity can relate to instances of another entity. It is shown using symbols at the ends of relationship lines.
One-to-one (1:1): Each instance of Entity A relates to exactly one instance of Entity B. Example: Each Employee has one CompanyLaptop. Shown with “1” on both ends or single vertical lines.
One-to-many (1:N): Each instance of Entity A can relate to multiple instances of Entity B, but each B relates to only one A. Example: One Customer places many Orders. Shown with “1” on one end and a crow’s foot (three-pronged fork) or “N” on the other.
Many-to-many (M:N): Instances of both entities can relate to multiple instances of the other. Example: Students enroll in multiple Courses, and Courses have multiple Students. Shown with crow’s feet or “N” on both ends. These require a junction table to implement.
Understanding these four components—entities, attributes, relationships, and cardinality—gives you the vocabulary to read, create, and discuss entity relationship diagrams effectively.
Benefits of creating ERD Diagrams
Creating an entity relationship diagram delivers tangible improvements to how teams design, build, and maintain data-driven systems.
Database planning and optimization
A thoughtfully designed ERD prevents the most expensive type of technical debt: fundamental structural problems that require extensive refactoring to fix. When you map out your entities and relationships before implementation, you can test different structural approaches without writing code.
ERDs expose normalization issues early. You might notice that you’re storing the same customer address in three different tables, or that your proposed structure would require complex queries for simple operations. Fixing these problems on a diagram takes minutes. Refactoring a production database with millions of records takes days and carries real risk.
Team communication and alignment
Database design discussions without visual aids quickly devolve into confusion. ERDs eliminate this ambiguity by giving everyone the same visual reference.
For cross-functional teams, this clarity is essential. Product managers can verify that the data model supports planned features. Designers can see what information will be available to display in interfaces. QA engineers can plan test scenarios based on the relationships between entities.
Reducing development errors and costs
Research consistently shows that bugs found during the design phase cost much less to fix than bugs found during implementation, and even less than bugs found in production. ERDs help catch errors earlier in the development lifecycle.
Common costly errors that ERDs prevent:
- Missing relationships: Discovering mid-implementation that you have no way to link customers to their subscription plans
- Circular dependencies: Creating entity structures where Table A depends on Table B, which depends on Table C, which depends on Table A
- Data duplication: Storing the same information in multiple places creates update anomalies
- Inadequate support for business rules: Building a structure that technically works but can’t enforce business constraints
Prerequisites: What you need before you start
Creating an effective entity relationship diagram requires gathering the right information and setting up proper tools.
Requirements gathering checklist
Before you start drawing entities and relationships, collect these inputs:
- Business requirements documentation: What does the system need to do? What information needs to be tracked?
- Existing data sources: If redesigning an existing system, export sample data and examine current database schemas
- User workflows: Map out the key actions users will take in the system
- Data volume estimates: How many records will each entity contain?
- Compliance and privacy requirements: What data needs special protection?
Stakeholder identification
Effective ERD creation isn’t a solo activity. Involve these stakeholders:
- Domain experts: The people who deeply understand the business area you’re modeling
- End users: The people who will interact with the system daily
- Database administrators: They bring expertise in performance optimization
- Backend engineers: They’ll implement the ERD as actual database schemas
- Product managers: They ensure the data model supports the product roadmap
Schedule collaborative working sessions instead of designing alone and asking for feedback afterward. Real-time discussion brings up questions and issues right away.
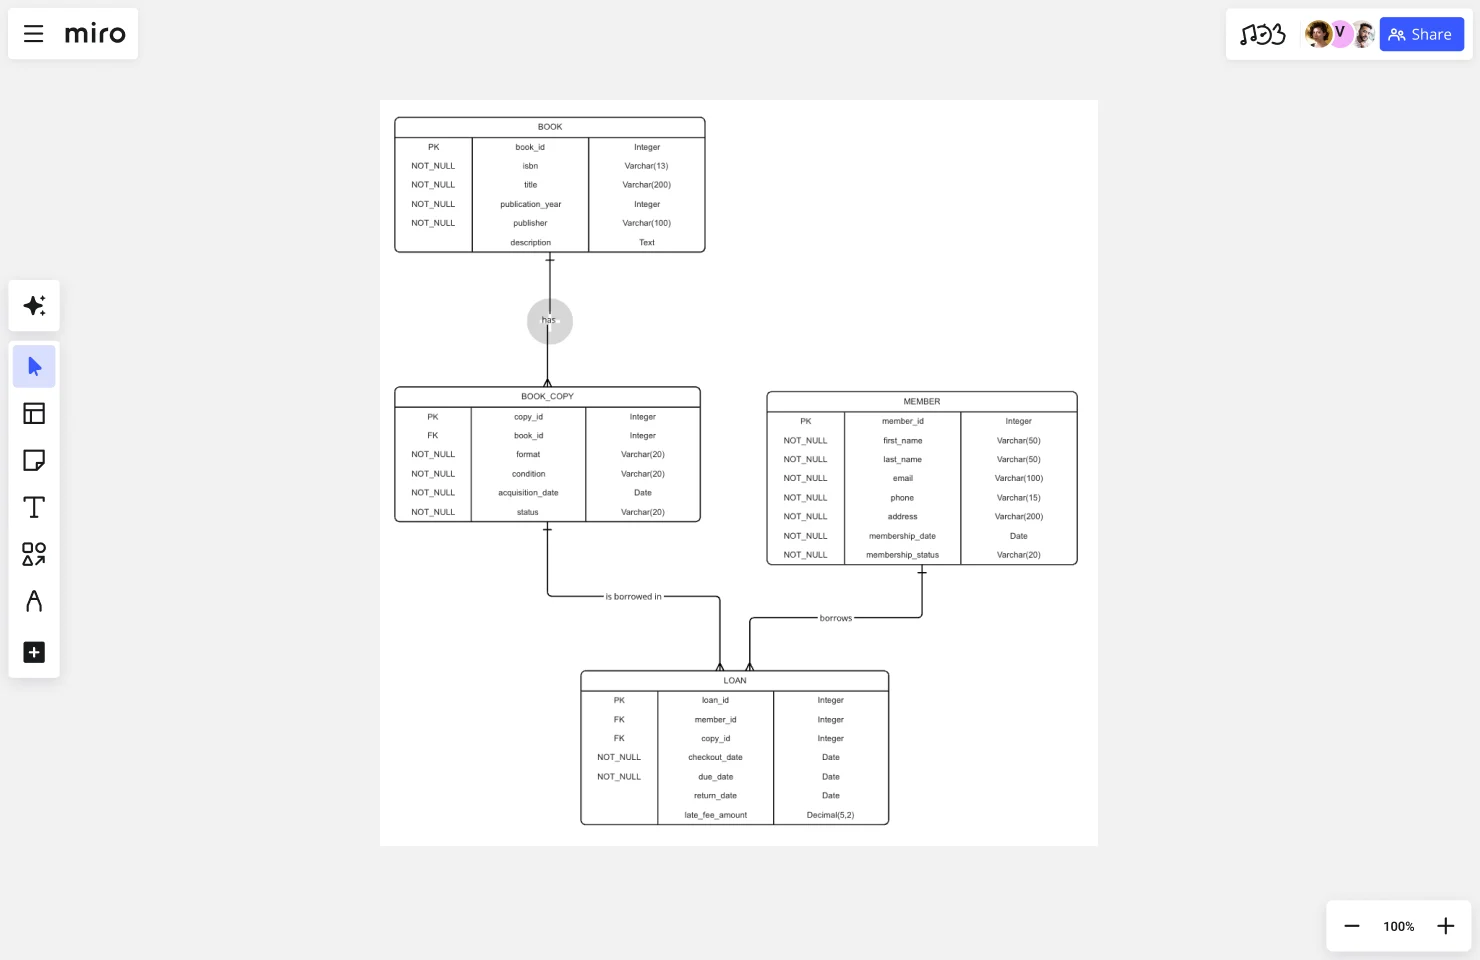
How to draw an ER Diagram: Step-by-step with example
Let’s walk through creating a complete entity relationship diagram by building a digital library system. This practical example will demonstrate each step of the process.
The scenario
We’re designing a system for a public library that wants to modernize how they track their collection and member activity. The library needs to:
- Manage their inventory of books, including multiple copies of the same title
- Track library members and their contact information
- Record when members borrow and return books
- Identify overdue items and calculate late fees
Step 1: Identify your entities
Entities represent the core concepts your system needs to track. Start by reviewing requirements and highlighting every noun that represents something you need to store information about.
For our library system, we identify:
- Book: Represents a title in the library collection (e.g., “To Kill a Mockingbird”)
- BookCopy: Represents individual physical or digital instances (the library might have 3 hardcover copies of the same Book)
- Member: Represents library patrons who can borrow materials
- Loan: Represents a borrowing transaction when a Member checks out a BookCopy
- Author: Represents book authors
- Category: Represents subject classifications (Fiction, History, Science)
Why separate Book and BookCopy? This is the classic “product vs. inventory” distinction. If we had just one Book entity, we’d need to duplicate title, author, and ISBN for every physical copy. Separating them means common data lives in one place (Book) while instance-specific data (condition, status) lives in BookCopy.
Questions to ask when identifying entities:
- What are the main subjects this system deals with?
- What things do users create, update, or delete?
- What would users want to search for or generate reports about?
Common mistakes to avoid: Don’t create entities for concepts that are really just attributes. “Address” might seem like an entity, but if it’s always tied to a specific customer and has no independent existence, it’s better modeled as attributes within Customer (street, city, state, zip).
Step 2: Define attributes for each entity
Once you’ve identified entities, determine what information you need to store about each one. List every piece of information users need to know about each entity.
Book:
- book_id (Primary Key)
- isbn
- title
- publication_year
- publisher
- description
BookCopy:
- copy_id (Primary Key)
- book_id (Foreign Key linking to Book)
- format (hardcover, paperback, ebook)
- condition (excellent, good, fair, poor)
- acquisition_date
- status (available, borrowed, damaged)
Member:
- member_id (Primary Key)
- first_name, last_name
- email, phone, address
- membership_date
- membership_status (active, suspended, expired)
Loan:
- loan_id (Primary Key)
- copy_id (Foreign Key linking to BookCopy)
- member_id (Foreign Key linking to Member)
- checkout_date, due_date
- return_date (null if not yet returned)
- late_fee_amount
Author:
- author_id (Primary Key)
- first_name, last_name
- birth_year
- nationality
Category:
- category_id (Primary Key)
- category_name
- description
Primary keys explained: Every entity needs a primary key — an attribute that uniquely identifies each instance. Primary keys should be unique (no duplicates), not null (every instance must have a value), and immutable (shouldn’t change over time). We’re using auto-incrementing integers (customer_id: 1, 2, 3…) for simplicity.
Attribute types:
- Simple attributes contain a single value (first_name, price, registration_date)
- Composite attributes can be broken into smaller parts (address into street, city, state, postal_code)
- Derived attributes can be calculated from other attributes (age from birth_date)
Step 3: Map relationships between entities
Relationships define how entities connect to each other. Identify them by examining how entities interact in your use cases.
For our library system:
Book to BookCopy: One-to-many. One Book (title) has many BookCopies (physical instances), but each BookCopy belongs to one Book. This lets us track individual copies while maintaining common information at the title level.
BookCopy to Loan: One-to-many. One BookCopy can appear in many Loans (borrowed multiple times over its lifetime), but each Loan involves one BookCopy. This tracks the borrowing history for each physical item.
Member to Loan: One-to-many. One Member can have many Loans (borrow multiple items over time), but each Loan belongs to one Member. This gives us the borrowing history for each patron.
Book to Author: Many-to-many. A Book can have multiple Authors (co-authored works), and an Author writes multiple Books. We’ll need a junction table called BookAuthor to implement this relationship, with book_id and author_id as foreign keys.
Book to Category: Many-to-many. A Book can belong to multiple Categories (“The Martian” might be filed under both Science Fiction and Adventure), and each Category contains multiple Books. We’ll create a BookCategory junction table.
Why a separate Loan entity? Loans capture a time-based event, not just a relationship. We need to know not only who currently has a book, but also the complete history of who borrowed it previously, when it was due, and whether there were late fees. Each checkout creates a new Loan record, building a historical record.
Understanding cardinality:
Walk through concrete examples to determine the right cardinality. For Customer-to-Order:
- Can one Customer have multiple Orders? Yes.
- Can one Order belong to multiple Customers? No (typically).
- Therefore: one-to-many relationship.
For Product-to-Category:
- Can one Product belong to multiple Categories? Yes (if your business allows it).
- Can one Category contain multiple Products? Yes.
- Therefore: many-to-many relationship.
Step 4: Add cardinality notations
Cardinality notation makes the multiplicity of relationships explicit on your ERD, removing ambiguity about how many entities can participate in each relationship.
Visual representation:
For one-to-one, mark both ends of the relationship with “1” or a single vertical line.
For one-to-many, mark the “one” side with “1” and the “many” side with “N,” “M,” or a crow’s foot symbol (a three-pronged fork). In our Book-to-BookCopy relationship, put “1” near Book and a crow’s foot near BookCopy.
For many-to-many, mark both sides with “N” or crow’s feet. Remember that implementing this relationship requires creating a junction table. Our Book-to-Author relationship shows crow’s feet on both ends, with the BookAuthor junction table implementing the connection.
Place cardinality notation close to the entity it describes, and keep relationship lines clear and uncluttered. Avoid crossing lines when possible by rearranging entity placement.
Step 5: Refine and validate your diagram
With your initial ERD complete, step back and evaluate it critically. This refinement phase catches structural issues before implementation.
Normalization check:
- First Normal Form (1NF): Each attribute should contain only atomic values — no lists or sets. If a Member has multiple phone numbers, don’t store them as “555-1234, 555-5678” in one field. Create a separate MemberPhone entity instead.
- Second Normal Form (2NF): Every non-key attribute should depend on the entire primary key. If you have an OrderItem entity with a composite key (order_id, product_id), don’t store product_name in OrderItem — it depends only on product_id. Keep product_name in the Product entity.
- Third Normal Form (3NF): Attributes should depend only on the primary key, not on other non-key attributes. Don’t store both city and state_name in an Address entity if you also store zip_code — the state can be derived from the zip code.
Validation checklist:
- Does every entity have a primary key? ✓
- Are all relationships necessary and correctly defined? ✓
- Are cardinality notations accurate? ✓
- Can the structure support all required queries? ✓
- Are there any many-to-many relationships that need junction tables? ✓
Peer review process:
Share your ERD with stakeholders:
- Domain experts validate that the model accurately represents business concepts and rules
- Database administrators review for technical feasibility and performance implications
- Fellow engineers check for completeness and edge cases
Test your design against key workflows:
Checkout process: Member scans card → system finds Member record → librarian scans book → system finds BookCopy → system creates Loan record. All necessary data present. ✓
Finding books by author: System queries BookAuthor junction table → retrieves all book_ids for that author_id → joins to Book to get titles. Structure supports this query efficiently. ✓
Overdue notices: System queries Loan where return_date is null AND due_date < today → joins to Member for contact info and to BookCopy and Book for item details. All data accessible. ✓
Step 6: Document and share
An ERD without proper documentation becomes difficult to interpret over time. Add context that ensures your diagram remains useful.
Adding annotations:
Include these elements directly on your ERD or in accompanying documentation:
- Entity descriptions: “BookCopy: Represents individual physical or digital instances of a Book title, allowing tracking of specific items’ location, condition, and borrowing history.”
- Relationship constraints: “An Order can only reference Products from the same Supplier” — business rules that aren’t captured by cardinality alone.
- Attribute constraints: “discount_percentage must be between 0 and 100” or “status must be one of: pending, processing, shipped, delivered.”
- Design decisions: “We chose to denormalize product_name into OrderItem to preserve the name at purchase time, even if the product is later renamed or deleted.”
Export and sharing:
Make your ERD accessible to everyone who needs it. Export in formats appropriate for different audiences — technical teams might prefer schema definition language while non-technical stakeholders need visual formats like PNG or PDF.
Link the ERD to related documentation. Connect it to your requirements documents, API specifications, and implementation code so people can trace from business requirements through data model to actual implementation.
Maintaining versions:
Treat your ERD as a living document:
- Use version control for ERD source files, just like you would for code
- Update the ERD when implementing database changes — if a developer adds a new table, they should update the ERD as part of that work
- Schedule periodic ERD reviews (quarterly or when planning major features) to ensure it still reflects reality
What this library ERD enables
With this structure in place, the library can:
- Generate reports on most popular books (join Loan to Book, count occurrences)
- Send overdue notices (query Loan where return_date is null and due_date passed)
- Track which copies need replacement (query BookCopy by condition and loan history)
- Recommend books (find Category matches from a member’s loan history)
- Calculate accurate late fees (track due_date and return_date in Loan)
- Manage inventory efficiently (see which Books need more Copies based on loan frequency)
The ERD translates abstract requirements like “track books and borrowing” into a concrete, implementable structure that supports all these use cases.
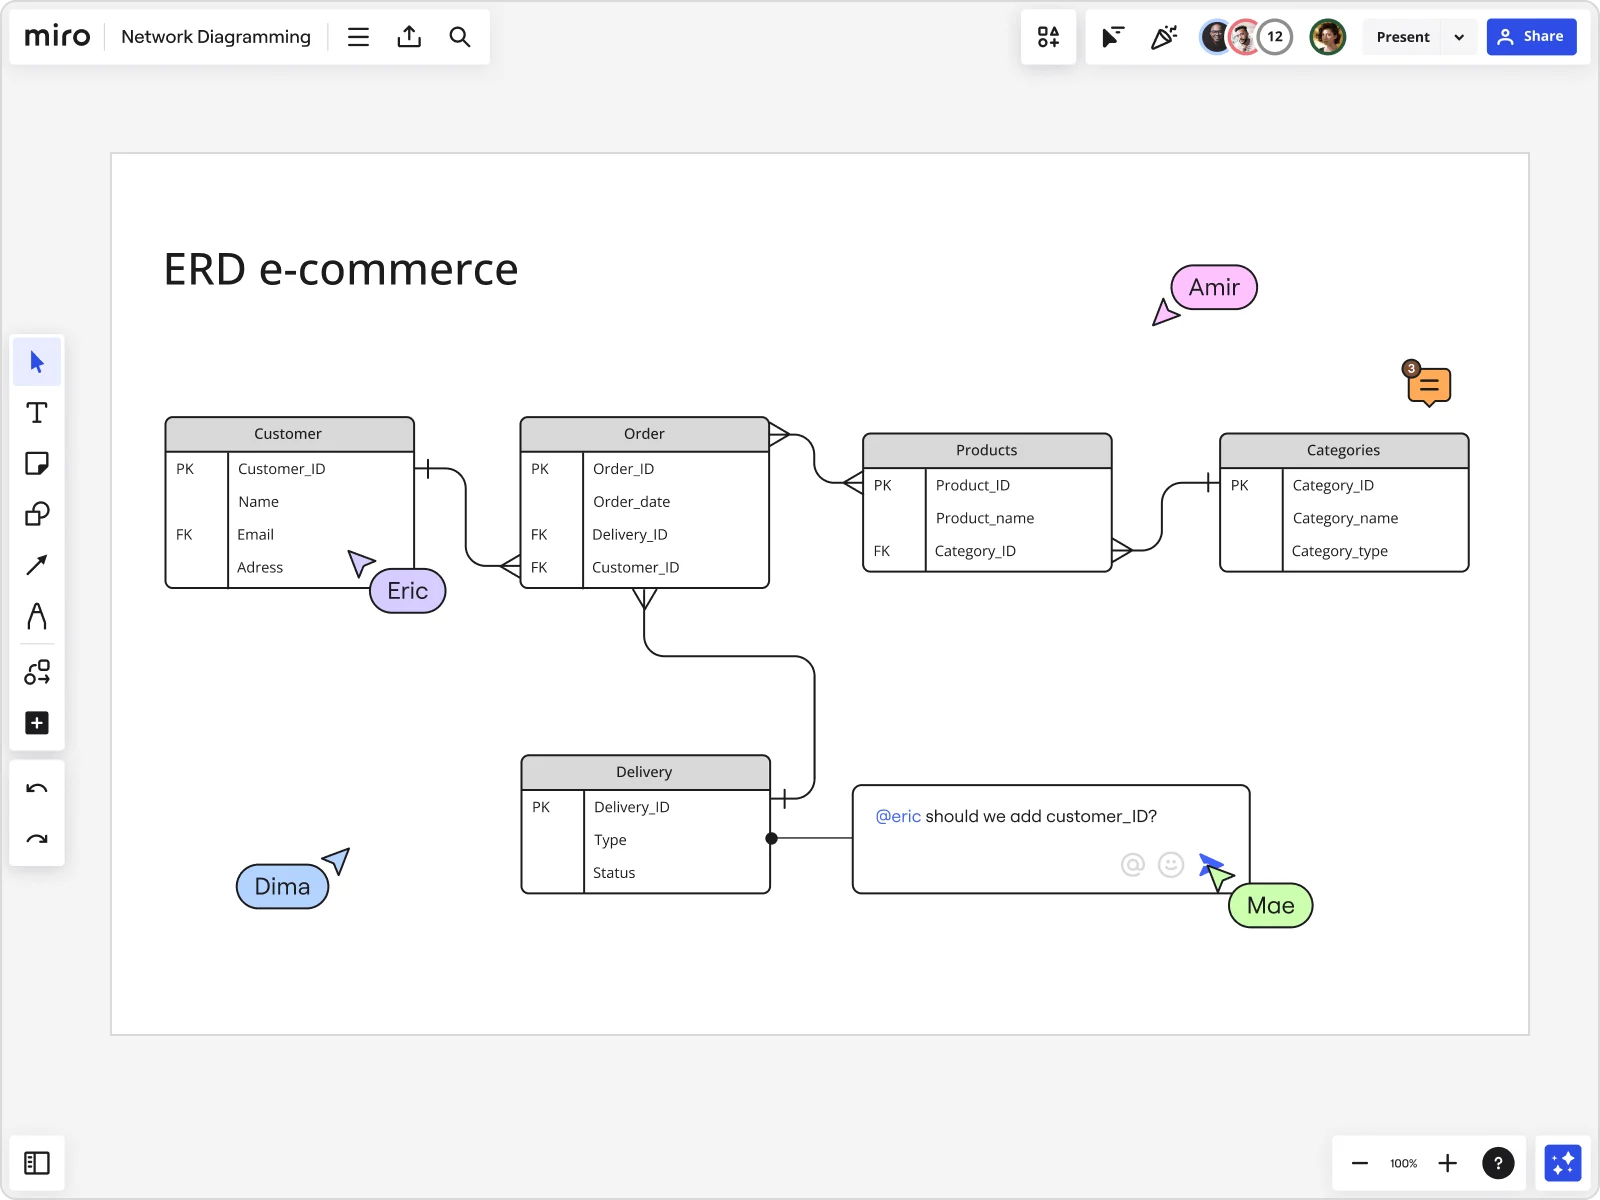
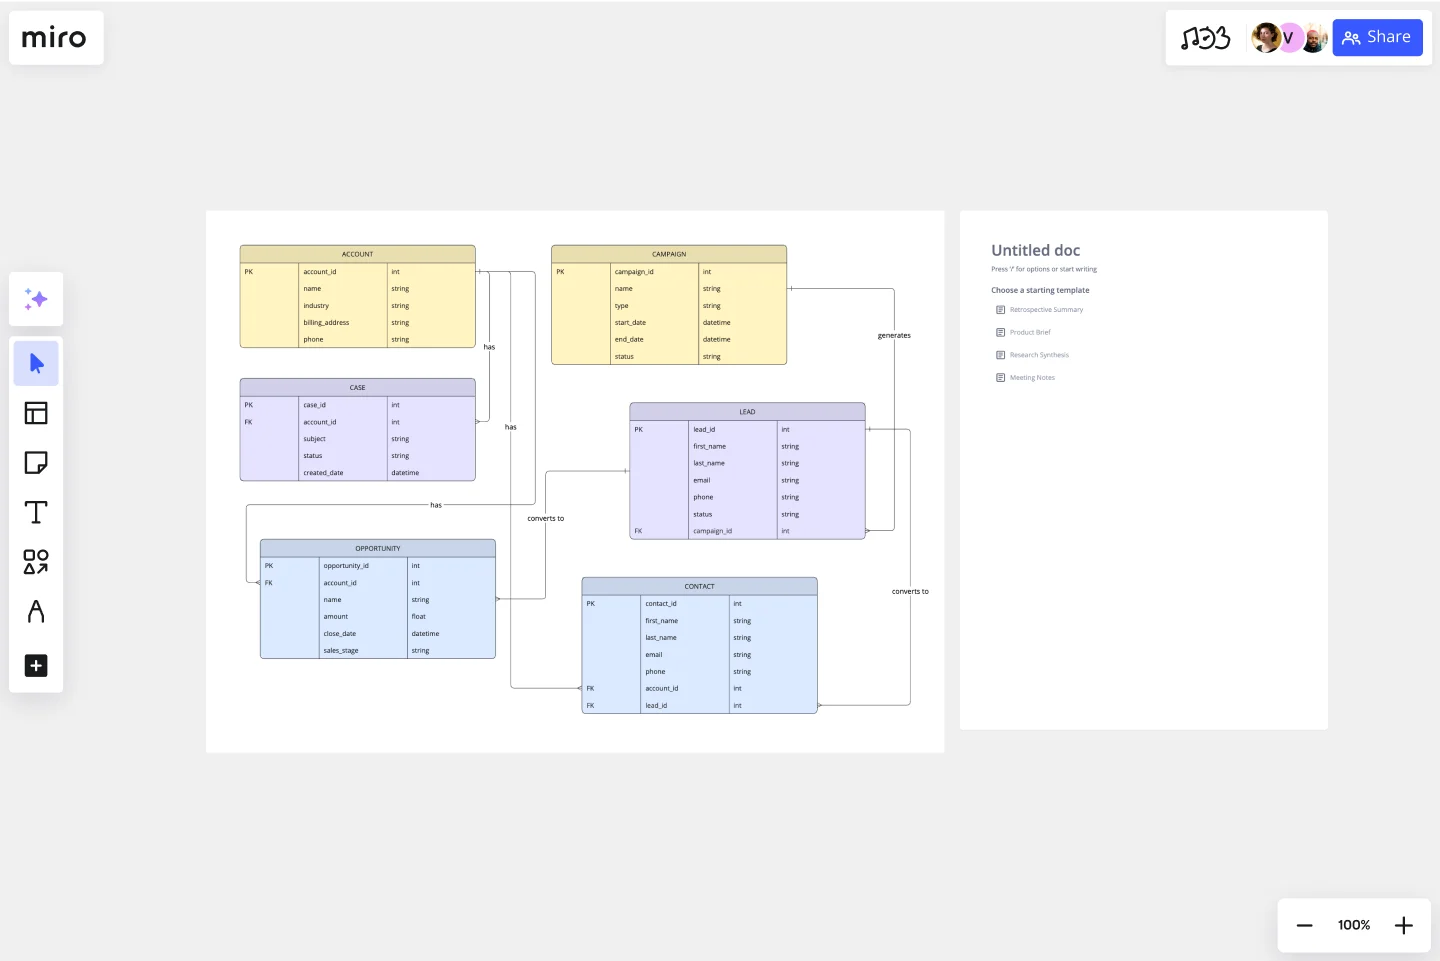
How to create an ERD in Miro
Visual collaboration platforms transform ERD creation from a solo technical task into a team activity where stakeholders contribute in real-time. Miro’s innovation workspace combines pre-built templates, AI-powered generation, and real-time collaboration to make ERD creation faster and more collaborative.
Why use Miro for ERD creation
Real-time collaboration: Multiple team members work on the same ERD simultaneously. Domain experts can clarify relationships the moment engineers draw them. Product managers verify that the structure supports planned features as entities take shape.
AI-powered jump-start: Describe your database requirements in plain text and let Miro AI generate a starting structure. Instead of manually creating boxes for each entity, you focus on refinement and validation.
Visual context processing: Miro AI can analyze existing brainstorming notes, requirements, or sticky notes on your board and convert them into structured ERD entities and relationships.
Accessible to all stakeholders: The visual, intuitive format makes ERDs accessible to non-technical stakeholders who might not understand traditional database notation.
Creating your ERD in Miro: Two approaches
Option 1: AI-generated diagrams
- Access Miro AI: Open a Miro board and click on the Formats icon
- Select Diagrams format: Choose Diagrams or mindmap from the Formats section
- Describe your requirements: Write a plain-text description like: “Create an entity relationship diagram for a library system that tracks books, book copies, library members, loans, authors, and categories. Books can have multiple copies and multiple authors. Members can borrow multiple book copies.”
- Review and refine: Miro AI generates entities and relationships. Use follow-up prompts to adjust: “Add a BookCopy entity that connects Book and Loan” or “Make Book and Author a many-to-many relationship”
- Add detailed attributes: Click on each entity box to add specific attributes like primary keys, foreign keys, and data fields
Pro tip: Select existing sticky notes or requirements on your board before prompting. Miro AI uses this visual context to generate more relevant diagrams based on your specific needs.
Option 2: Template-based creation
- Open the ERD template: Search for “entity relationship diagram” in Miro’s template library
- Customize entity boxes: Rename and add attributes to pre-formatted entity boxes
- Draw relationships: Use template connectors to link entities and add cardinality notation
- Add junction tables: For many-to-many relationships, create junction entities that connect both sides
Collaborative refinement
Once your basic structure is in place:
- Annotate with context: Add text boxes explaining design decisions
- Invite collaborators: Share the board with database administrators, engineers, and domain experts
- Comment on specific elements: Use @mentions to notify team members when you need input on particular entities or relationships
- Iterate in real-time: Schedule working sessions where team members join simultaneously to refine the design together
Miro captures the full design conversation — not just the final ERD, but the comments, alternatives considered, and reasoning behind choices — creating living documentation that helps future team members understand your data architecture decisions.
Best practices for drawing effective ER Diagrams
Well-designed ERDs balance completeness with clarity.
Clarity and simplicity principles
Start simple, then add complexity. Begin with core entities and obvious relationships. Once those are validated, layer in edge cases and specialized entities. If your ERD has more than 15-20 entities, split it either by increasing abstraction or partitioning by domain.
Don’t cram entities together. Leave space around relationship lines so cardinality notation is clearly visible. Group related entities with generous spacing between groups to show domain boundaries visually.
Naming conventions and standards
Entity names: Use singular nouns (Product, not Products; Order, not Orders).
Attributes: Use snake_case or camelCase consistently, never mix them. Choose descriptive names: “order_date” is clearer than “date,” “product_price” clearer than “price.”
Relationships: Name relationships with verbs that read naturally: “Customer places Order,” “Product belongs-to Category.” The relationship name should make sense reading from either direction.
Primary keys: Follow a consistent pattern. Many teams use “entity_name_id” (customer_id, order_id) to make primary keys instantly recognizable.
Foreign keys: Name foreign keys to clearly indicate what they reference. If the Order entity has a foreign key referencing Customer, name it customer_id, not customer_ref or customer_fk.
Layout and organization strategies
Position related entities near each other to minimize relationship line length and reduce crossings. Follow logical flow — arrange entities to reflect workflow or process flow where applicable. In our library example, positioning Member → Loan → BookCopy → Book mirrors the checkout process.
Use color purposefully. Color-code entities by domain (all inventory-related entities in blue, all customer-related entities in green) to make domain boundaries immediately visible. Don’t overdo it — too many colors become distracting.
Documentation standards
Add these contextual elements:
- Entity descriptions: One-sentence explanation of what each entity represents and its purpose
- Attribute constraints: Document validation rules, allowed values, and calculation logic (“late_fee_amount: Calculated as (days_overdue × daily_rate)”)
- Relationship explanations: For non-obvious relationships, explain the business meaning (“Why is Loan connected to BookCopy rather than Book? Because we need to track which specific physical copy was borrowed”)
- Assumptions: Document assumptions baked into the design (“We assume each Order has exactly one shipping address. If we need split shipments to multiple addresses, this structure would need revision”)
Common mistakes when creating ER Diagrams
Recognizing these errors early saves significant refactoring effort later.
Over-complication and feature creep
The mistake: Trying to model every possible edge case and future feature in the initial ERD, resulting in bloated diagrams with dozens of entities, many of which won’t be needed.
The solution: Start with the minimum viable data model that supports current requirements. Add entities and relationships when you’re actually building features that need them. Practice “YAGNI” (You Aren’t Gonna Need It). If stakeholders insist on planning for future scenarios, document them separately as “Future Considerations” rather than implementing them in the initial ERD.
Incorrect relationship mapping
Common examples:
- Making Book-to-Loan a direct one-to-many relationship (skipping BookCopy), creating ambiguity about which specific copy was borrowed
- Using one-to-many when many-to-many is needed (modeling Student-to-Course as one-to-many fails because each Course also has many Students)
- Creating redundant relationships (if Order connects to Customer and OrderItem connects to Order, you don’t need a separate OrderItem-to-Customer relationship)
The solution: Validate cardinality by asking questions in both directions. Walk through real-world scenarios with domain experts: “Can a single product be in multiple categories?” “Can an order belong to more than one customer?”
Poor entity identification
The mistake: Creating entities for concepts that should be attributes, or making attributes when separate entities are needed.
Examples:
- Entity when attribute is appropriate: Creating an “Address” entity when addresses have no independent existence and always belong to exactly one customer. Use address attributes within Customer instead.
- Attribute when entity is appropriate: Storing “author_name” as a single text field in Book fails when books have multiple authors or when you need to query “all books by this author.”
The solution: Ask these questions:
- Does this concept have independent existence apart from other entities?
- Do I need to track multiple instances of it?
- Will I need to query or report on this concept separately?
If “yes” to any, it’s probably an entity. If “no” to all, it’s likely an attribute.
Inadequate normalization
Common example: Storing product_name, product_description, and product_price directly in OrderItem creates problems:
- If product details change, historical orders show outdated information
- The same data is duplicated across every order containing that product
- There’s no single source of truth for product information
The solution: Separate concerns. Store historical data (price at time of purchase) separately from current data (current product details). Follow normalization rules to eliminate redundancy:
- 1NF: No repeating groups or comma-separated values
- 2NF: No partial dependencies
- 3NF: No transitive dependencies
Missing validation with stakeholders
The mistake: Designing the ERD in isolation, then discovering during implementation that it doesn’t match actual business rules.
Example: Modeling a healthcare system where you assume each patient has one primary physician, only to learn during implementation that patients can have multiple primary care doctors for different specialties.
The solution: Validate ERDs with domain experts before implementation:
- Walk through key use cases: “When a patient schedules an appointment, what information do we need?”
- Show concrete examples: “Here’s how we’d store Dr. Smith treating both John and Jane. Does this match reality?”
- Test edge cases: “What happens when a patient transfers from one doctor to another mid-treatment?”
Schedule dedicated review sessions — don’t just send the ERD via email and hope for feedback.
Ready to create your first ERD with Miro?
Entity relationship diagrams transform abstract data requirements into concrete, implementable structures that guide database design and keep teams aligned. By following the systematic approach outlined in this guide — from identifying entities and defining attributes to mapping relationships and validating with stakeholders — you’ll create ERDs that prevent costly structural problems and serve as reliable reference documentation throughout your project’s lifecycle.
The key to effective ERD creation is collaboration. When engineers, product managers, designers, and domain experts work together in real-time, design flaws surface immediately rather than during implementation. Visual collaboration platforms with AI-powered diagramming make this possible by giving everyone access to the same workspace where they can contribute, comment, and validate design decisions as they happen — and by accelerating the initial creation process so teams can focus on refinement rather than mechanical setup.
Start with your next database design project. Open a collaborative workspace, describe your requirements to AI or use a pre-built template, and gather your stakeholders to refine, validate, and document the design together. The time invested in thoughtful ERD design pays dividends in reduced refactoring, clearer team communication, and databases that actually support the features your users need.
Start building with Miro’s entity relationship diagram template and AI features, and experience how visual collaboration transforms database design from technical documentation into strategic team alignment.
Frequently Asked Questions About Entity Relationship Diagrams
What is the difference between an ERD and a UML class diagram?
While both ERDs and UML class diagrams show entities and their relationships, they serve different purposes. ERDs focus purely on data structure — what information needs to be stored and how it relates. They’re used primarily for database design. UML class diagrams, on the other hand, represent object-oriented software design and include both data (attributes) and behavior (methods/functions). If you’re designing a database schema, use an ERD. If you’re modeling application classes and their interactions, use UML class diagrams. In practice, your ERD entities often map directly to persistent domain classes in object-oriented systems.
How long does it take to create an ERD?
The time required depends on system complexity and team involvement. A simple ERD for a small application with 5-10 entities might take 1-2 hours, including stakeholder validation. Medium complexity systems with 15-25 entities typically require 4-8 hours across multiple sessions. Large enterprise systems can take several days or weeks, especially when documenting existing databases or coordinating across multiple teams. Using AI-powered tools like Miro’s Create with AI can cut initial creation time significantly by generating starting structures from text descriptions, letting you focus time on refinement and validation rather than mechanical setup.
Can non-technical people create ERDs?
Yes, especially with visual collaboration tools that make ERD creation more accessible. While non-technical people may not understand all database concepts like normalization or foreign keys, they can absolutely identify entities (the main “things” the system tracks), list attributes (information about those things), and describe relationships (how things connect). Domain experts often create the most accurate ERDs because they deeply understand business rules and workflows. The key is pairing non-technical domain knowledge with technical guidance from engineers or database administrators who can ensure the structure follows database design principles.
What’s the difference between logical and physical ERDs?
Logical ERDs show the structure of information independent of any specific database system. They include entities, attributes, primary keys, and relationships, but don’t specify implementation details like data types, indexes, or database-specific constraints. Physical ERDs show exactly how the database will be built in a specific system (PostgreSQL, MySQL, Oracle). They include table names, column data types (VARCHAR(255), INT, etc.), indexes, constraints, and platform-specific features. Start with a logical ERD to get the structure right, then create a physical ERD when you’re ready to implement. This separation lets you change technical implementation without redesigning your entire data model.
How often should ERDs be updated?
ERDs should be living documents that evolve with your database. Update your ERD whenever you make structural changes to the database — adding tables, modifying relationships, or changing key attributes. Treat ERD updates as part of your development process, not separate documentation work. When a developer adds a new table, they should update the ERD in the same workflow. Schedule quarterly ERD reviews for mature systems to catch any drift between documentation and implementation. An outdated ERD is worse than no ERD because it misleads new team members and leads to incorrect assumptions during development.
Can AI help create entity relationship diagrams?
Yes, AI can significantly accelerate ERD creation. AI-powered tools can generate initial ERD structures from plain text descriptions of your requirements, saving time on the mechanical work of creating entity boxes and relationship lines. You can describe what your system needs to track, and AI produces a starting diagram showing entities and their connections. AI can also analyze existing brainstorming notes or requirements documents on your board and convert them into structured diagrams. However, AI-generated ERDs require human review and refinement — you still need domain experts to validate that relationships match business rules, engineers to ensure technical soundness, and stakeholders to confirm the structure supports planned features.
Do I need special software to draw an ERD?
No, you can create ERDs with various tools depending on your needs. Visual collaboration platforms like Miro work well for team-based design with stakeholders across functions — they’re accessible, support real-time collaboration, and don’t require technical expertise. Traditional database design tools offer advanced features like schema generation and validation but have steeper learning curves. Even general diagramming tools or whiteboards work for simple ERDs. The best tool is one your entire team can access and use. For early-stage design and stakeholder validation, prioritize collaboration and accessibility. For technical implementation, prioritize precision and schema generation capabilities.
How detailed should my ERD be?
ERD detail depends on your project phase and audience. Conceptual ERDs used for early stakeholder discussions show only major entities and high-level relationships — enough to validate business requirements without overwhelming non-technical participants. Logical ERDs add all attributes, primary keys, and complete relationship details but remain database-agnostic. Physical ERDs include every implementation detail: data types, indexes, constraints, and platform-specific features. Start simple with core entities and obvious relationships, then add complexity as your understanding deepens. Avoid trying to capture every edge case in the initial ERD — you’ll discover details during implementation. The right level of detail is whatever helps your current task, whether that’s stakeholder alignment, technical design, or database implementation.
Author: Miro Team
Last update: December 12, 2025